Translate this page into:
Pulmonary graphics – An insight into newborn lung on ventilator
*Corresponding author: H. A. Venkatesh, Department of Neonatology, Manipal Hospital, Bengaluru, Karnataka, India. venkatveena46@gmail.com
-
Received: ,
Accepted: ,
How to cite this article: Venkatesh HA, Venkatesh S. Pulmonary graphics – An insight into newborn lung on ventilator. Karnataka Paediatr J. 2024;39:79-83. doi: 10.25259/KPJ_19_2024
Abstract
Neonatal care with technology has brought down mortality and morbidity in the world. More and more pre-term neonates are seeing the world with a quality life. Advanced software is used in the ventilators to check the breath-to-breath variability in the care of sick neonates. The anatomical and physiological aspects of a neonatal lung are essential before understanding and analysing the waves on the monitor. Constant monitoring of both the baby and the waves of lung mechanics is essential in clinical decision-making. Having a sophisticated machine with the graphics of lung mechanics is of no use if the clinician is incapable of correctly interpreting the waves. The pulmonary graphics is the graphical representation of the lung similar to the electrocardiogram and electroencephalogram routinely used to know the physiology of the heart and brain. With this background, the pulmonary graphics are dealt with simply, and therefore, the reader can understand the pulmonary graph well and use it efficiently in the care of sick neonates. The incorporation of microprocessors and sensors into the ventilators has made the clinician monitor lung function continuously in real time. The three basic parameters of the respiratory system – the pressure, the flow, and the volume – are visualised online. This can be utilised along with the clinical data, the blood gas, and the chest Roentgenogram.
Keywords
Neonate: Pulmonary graphics
Neonate
Lung
Pulmonary graphics
INTRODUCTION
Neonatal care with advanced technology has brought down mortality and morbidity in the world. More and more pre-term neonates are seeing the world with a quality life. Advanced software is used in the ventilators to check the breath-to-breath variability in the care of sick neonates.[1] The anatomical and physiological aspects of a neonatal lung are essential before understanding and analysing the waves on the monitor. Constant monitoring of both the baby and the waves of lung mechanics is essential in clinical decision-making. Having a sophisticated machine with the graphics of lung mechanics is of no use if the clinician is incapable of correctly interpreting the waves. The pulmonary graphics are the graphical representation of the lung similar to the electrocardiogram and electroencephalogram routinely used to know the physiology of the heart and brain, respectively. With this background, the pulmonary graphics are dealt with simply, and therefore, the reader can understand the pulmonary graph well and use it efficiently in the care of sick neonates. The incorporation of microprocessors and sensors into the ventilators has made the clinician monitor lung function continuously in real time. The three basic parameters of the respiratory system – the pressure, the flow, and the volume – are visualised online. This can be utilised along with the clinical data, the blood gas, and the chest roentgenogram.
THE MICROPROCESSOR AND SENSORS
The technology helps the clinician to understand the breath-to-breathe interaction between the patient and the ventilator. The flow sensor is the backbone of pulmonary graphics. The sensor measures the amount of cooling air that passes over the heated wire, and the cooling effect indicates more flow of gas. The pressure that is generated in a spontaneously breathing neonate by the respiratory muscle or by the ventilator in a mechanically ventilated initiates the flow to overcome the resistance of the compliance and the inertial properties of the respiratory system. This, in turn, creates a change in volume in the lung. The pressure and time are measured back at the machine, and the flow is measured at the patient. The volumes – the inspiratory and expiratory tidal volumes – are derived from flows and read at patient wye through a flow sensor [Figure 1].

- (a) The flow sensor-heated wire anemometer is a data link between the patient and the machine (arrow). (b)The monitor shows the pressure-time curve only when the sensor is not attached. (c)With an intact sensor, the flow and volume curves are also seen.
GRAPHICS
The pulmonary graphics help the clinician to understand the real-time data – scalar waveforms, loops, and trends from the proximal airway pressure displayed on the ventilator screen. The pressure, the flow, and the tidal volume waveform are the scalar displays, and volume versus pressure, flow versus pressure, and the flow versus volume are the loops. The trends include compliance, resistance, minute volume maximum pressure, minimum pressure and mean pressure, oxygen %, and carbon dioxide diffusion coefficient against time (in High-frequency oscillation [HFO]). The respiratory parameters are plotted on a two-dimensional X-Y graph as pressure against time, flow against time and volume against time and provide valuable information about the pattern of breathing and status of the lung. The interpretation of graphics is required when a baby is mechanically ventilated to understand the trend, to help the baby from the untoward effect of the ventilator, to study the impact of clinical morbidity on the graph, and to observe the improvement upon the drug administration. The scalar graphics and the loops are the two graphical representations of the respiratory mechanics in mechanically ventilated neonates. In the scalar graphics, the pressure, the flow, and the volume are measured against time. The flow and the pressure are depicted against the volume in the loop graphics. The pressure-time curve demonstrates two pressures, including the peak endexpiratory pressure (PEEP) and peak inspiratory pressure (PIP), and the mean alveolar pressure (MAP), the area under the curve. The PIP, the inspiratory time, and the MAP determine the oxygenation. The trigger, the limit, and the cycling are the breath characteristics in completing effective respiration.[2-5]
BREATH ON PULMONARY GRAPHICS
In spontaneous breathing, the inspiration is below the baseline and started by the patient’s effort, and expiration is above the baseline and is by the machine’s effort. The three characteristics of a breath include trigger, limit, and the cycle. The MAP is a function of PIP, PEEP, inspiratory time, and the rate [Figure 2].

- Characteristics of breath (ventilator and patient breath). (2) Trigger (cause for breath to begin), limit (cause for regulation of breath), cycle (cause for breath to end), and (1) the mean alveolar pressure. PEEP: Peak end-expiratory pressure, PIP: Peak inspiratory pressure, MAP: Mean alveolar pressure. The red- line represents IT. IT is inspiratory time. Until the dotted line is the inspiratory phase.
CURVES
The pulmonary graphics are broadly classified into a scalar (three opened curves), loops (two closed curves), and trend. They are depicted in the images.
THE SCALAR GRAPHICS
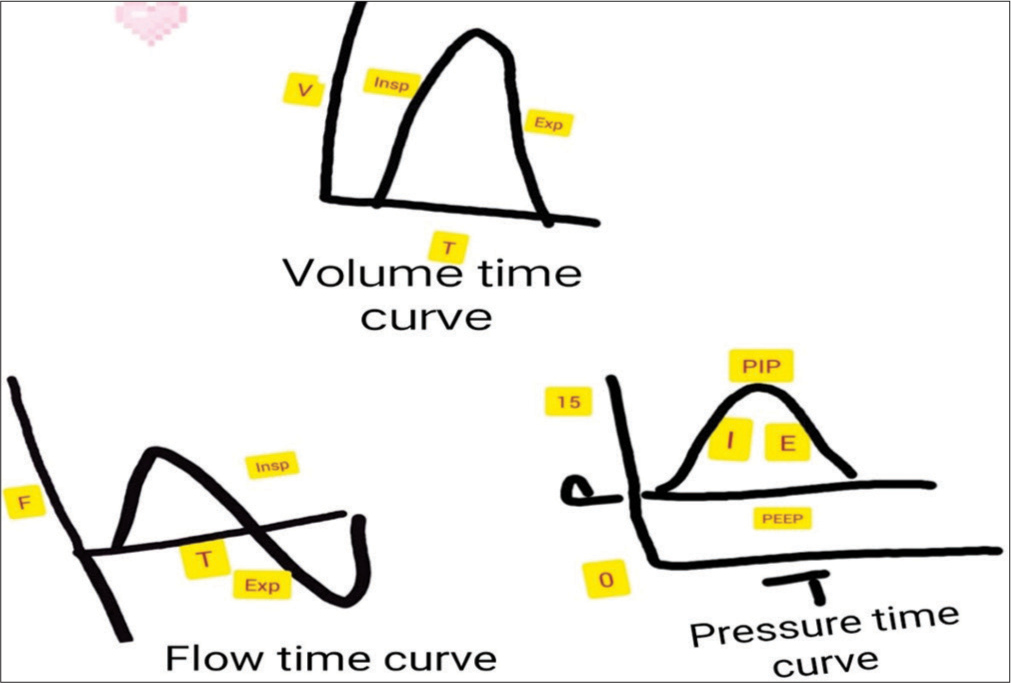
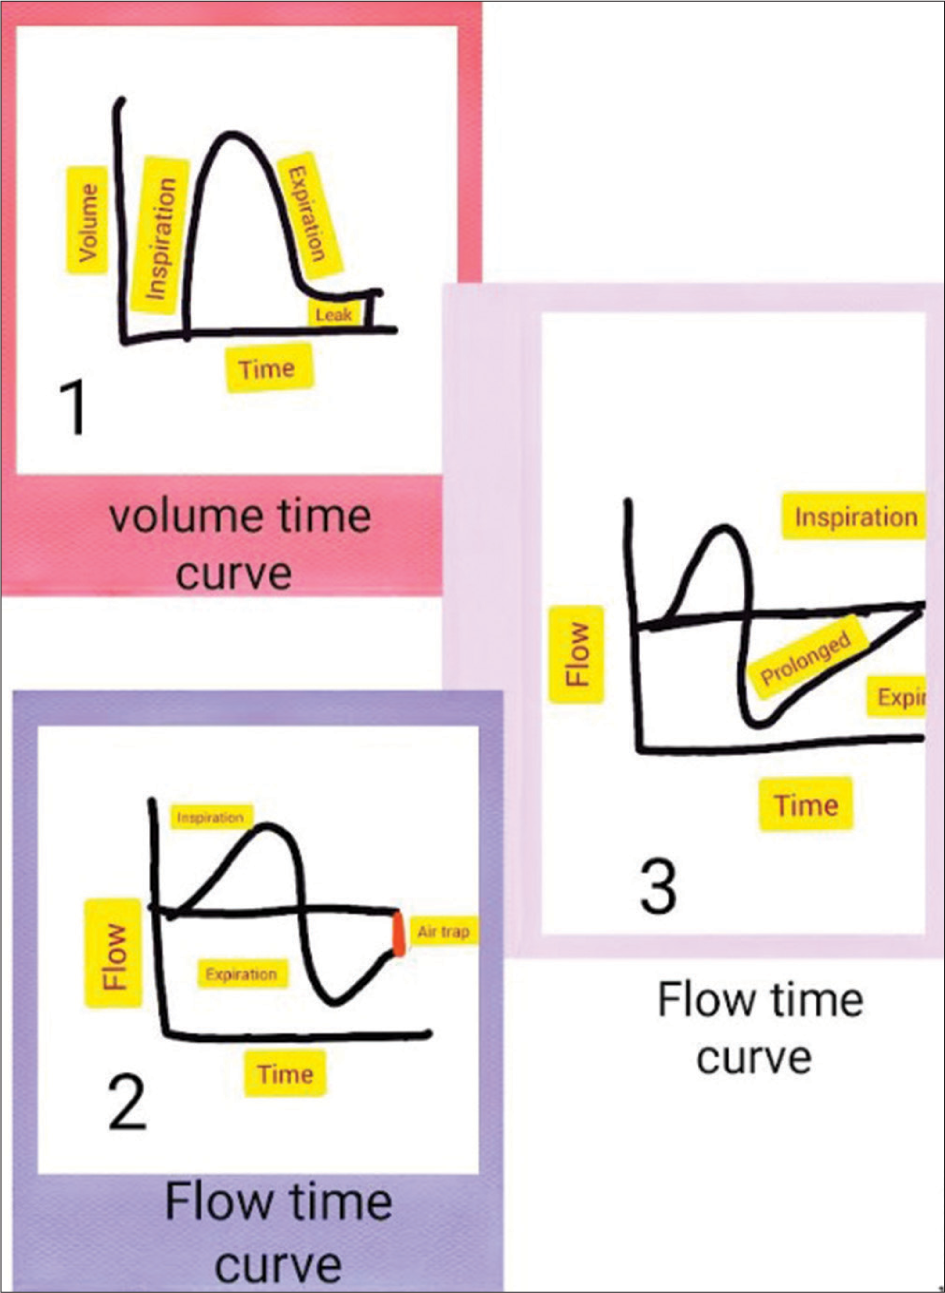
In scalar graphics the pressure, the flow, and the volume are depicted against the time [Figures 3 and 4]. The flow volume and the pressure-volume curves are depicted in the loop graphics.[6,7] The normal and abnormal graphics are depicted with the explanation in the respective images.[8-15]

- The scalar graphics demonstrate pressure, flow, and volume versus time curves. The flow time curve is biphasic, and the pressure time and volume time curves are monophasic. The pressure curve against the time shows peak end-expiratory pressure and peak inspiratory pressure (0-15), I (inspiration), E (expiration), the volume-time curve demonstrating inspiration and expiration, and the flow time curve demonstrating the inspiratory (above the baseline) and expiratory flow (below the baseline). V: Volume, T: Time, F: Flow, Insp: Inspiration, Exp: Expiration, PEEP: Peak endexpiratory pressure, PIP: Peak inspiratory pressure,

- (1) Volume time curve demonstrating air leak (expiratory trace descends smoothly and then plateaus and does not reach the baseline), (2) flow time curve demonstrating prolonged expiration meaning increased expiratory resistance, (3) flow time curve demonstrating air trap where in the expiratory phase not reaching the baseline.
LOOPS
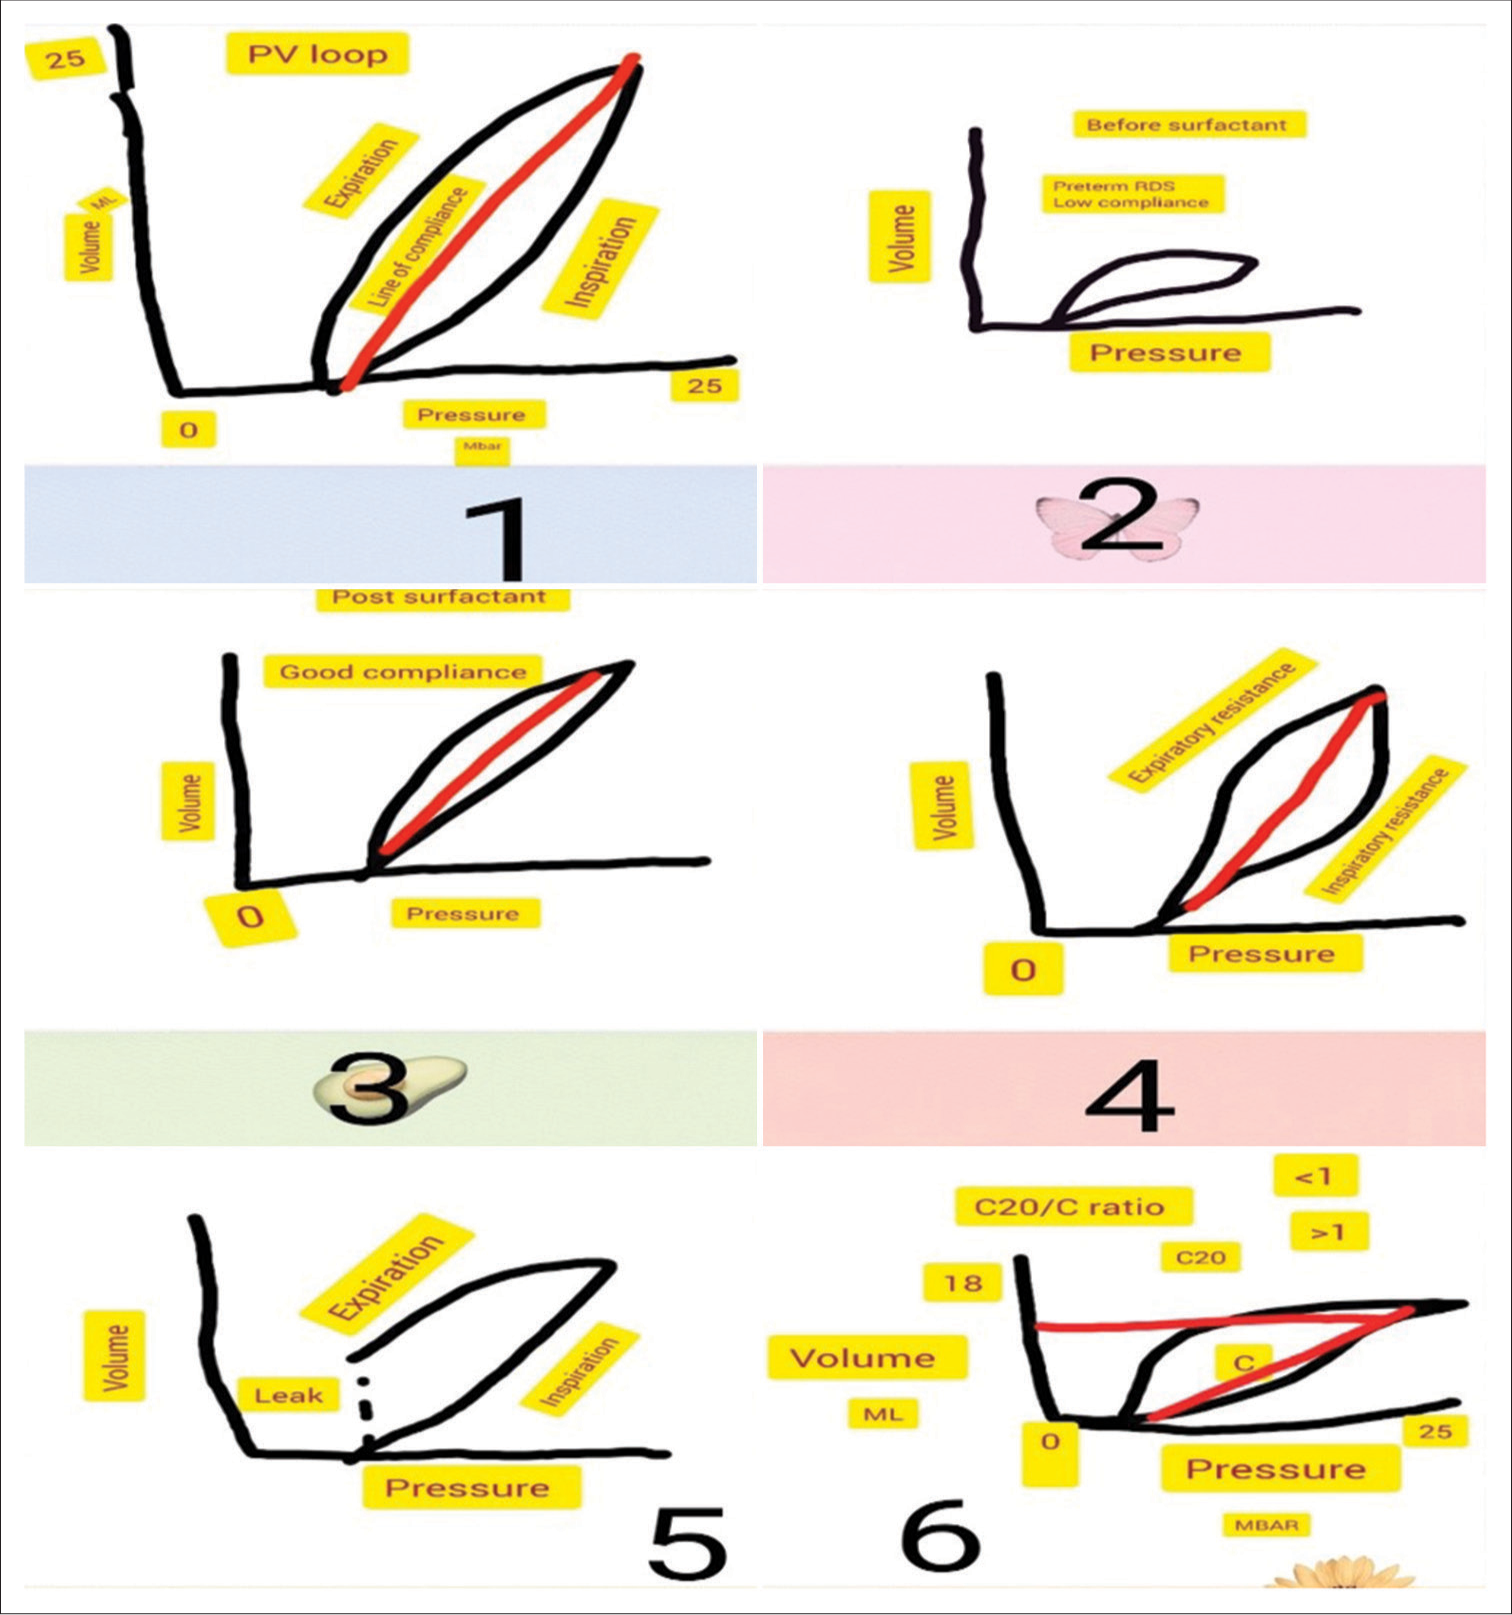
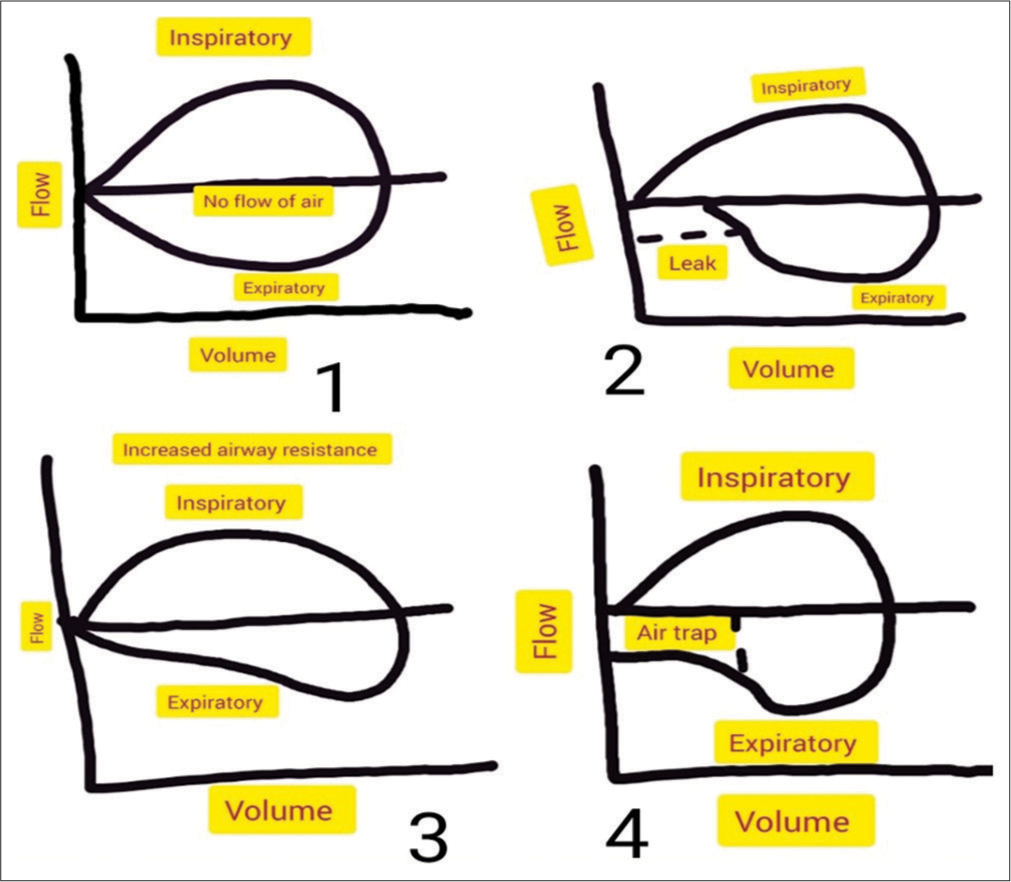
Graphical representation of the inspiratory and expiratory flow, including both the patient and ventilatory-triggered breath. Pressure volume and flow volume loops are described in normal and abnormal conditions [Figures 5 and 6].

- (1) Normal pressure-volume loop, (2) Low compliance loop as seen in pre-term respiratory distress syndrome with low compliance, (3) Good compliance loop post-surfactant administration, (4) Loop showing inspiratory and expiratory resistance, (5) Loop showing Endotracheal tube (ET) leak, (6) Loop showing beaking phenomena indicating hyperinflation of alveoli. The C20/C ratio is the ratio between the last 20% of the compliance to the total compliance. A ratio of more than one is normal, and <1 indicates hyperinflation. Pressure 0-25, C is compliance MBAR is the millibar.

- (1) Flow-volume curve showing normal (the inspiratory and expiratory flow come and join the same point where no airflow happens), (2) expiratory leak (the expiratory volume does not return to the zero volume level and the volume of leak indicates the magnitude), (3) increased expiratory resistance (scooped out expiratory tracing), (4) air trap (the expiratory trace does not return to baseline).
THE TREND OF VENTILATOR PARAMETERS
The trend data are very important to understand the impact of different clinical events that happen in a ventilated baby over time and it helps in deciding the clinical improvement. The FIo2 requirement, the compliance, and the resistance can be recorded as a trend over time.
CONCLUSION
Pulmonary graphics are an innovation in the respiratory care of newborns. Having a basic knowledge of neonatal respiratory physiology with good physical examination and adequate knowledge of the respirator, the pulmonary graphics would be a great adjuvant as a bedside monitoring tool while ventilating a newborn.
Ethical approval
Institutional Review Board approval is not required.
Declaration of patient consent
Patient consent is not required as there are no patients in this study.
Conflicts of interest
There are no conflicts of interest.
Use of artificial intelligence (AI)-assisted technology for manuscript preparation
The authors confirm that there was no use of artificial intelligence (AI)-assisted technology for assisting in the writing or editing of the manuscript and no images were manipulated using AI.
Financial support and sponsorship
Nil.
References
- Real-time pulmonary graphics. Semin Fetal Neonatal Med. 2015;20:181-91.
- [CrossRef] [PubMed] [Google Scholar]
- Flow-synchronized ventilation of preterm infants with respiratory distress syndrome. J Perinatol. 1994;14:90-4.
- [Google Scholar]
- Flow measurement in mechanical ventilation: A review. Med Eng Phys. 2015;37:257-64.
- [CrossRef] [PubMed] [Google Scholar]
- Accuracy of small tidal volume measurement comparing two ventilator airway sensors. J Pediatr Intensive Care. 2013;2:33-8.
- [Google Scholar]
- Assisted ventilation of the neonate In: An evidence-based approach to newborn respiratory care (6th ed). Philadelphia, PA: Elsevier. Inc.; 2017.
- [Google Scholar]
- Ventilación Mecánica en recién nacidos, lactantes e niños (3rd ed). Madrid: Ergon; 2018.
- [Google Scholar]
- Manual de ventilación Mecánica pediátrica e neonatal, grupo de trabajo de respiratorio In: SECIP. Madrid: Ergon; 2015.
- [Google Scholar]
- Pressure-time relationships of pressure-limited neonatal ventilators. Crit Care Med. 1983;11:177-81.
- [CrossRef] [PubMed] [Google Scholar]
- Ventilator waveform interpretation in mechanically ventilated small animals. J Vet Emerg Crit Care (San Antonio). 2011;21:496-514.
- [CrossRef] [PubMed] [Google Scholar]
- Real-time pulmonary graphic monitoring. Clin Perinatol. 2007;34:1-17, v.
- [CrossRef] [PubMed] [Google Scholar]
- Clinical applications of pulmonary function and graphics. Semin Neonatol. 2002;7:391-9.
- [CrossRef] [PubMed] [Google Scholar]
- The flow-pressure plot: A new look on the patient-ventilator interaction in neonatal care. Semin Perinatol. 2002;26:425-31.
- [CrossRef] [PubMed] [Google Scholar]


